Tutorial: Percentage Change
In the sectors tutorial, we looked at adding % Price change since columns to identify sectors that had been under- or over-performing over specified periods.
In this tutorial, we look at how it is also possible to see the movement of a stock or index on a more "ad hoc" basis; drawing a Percentage Change line on a graph. This will tell you the actual price change, and the percentage change, between the start and end points of the line.
Adding a percentage change line
This feature can be found in the Lines & Text sub-menu on the Graph context menu. Alternatively, you may have the ![]() toolbar button on your Graph Toolbar.
toolbar button on your Graph Toolbar.
When you select this option, the cursor will change to a cross.
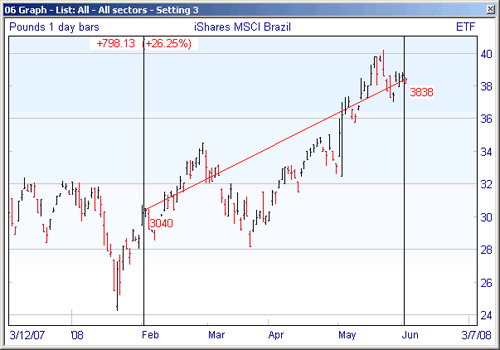
Simply left click and drag over a section of the graph to view the percentage change over that period. The line will snap to the closing price on the start and dates of the line. The start and end points of the line will be labelled with the closing price on each day. At the top of the graph, above the start point, the change in price for the period and the percentage change will be displayed.

So long as you keep the left mouse button held down you will continue to see the line showing the percentage change, so you can move the end point of the line to different places on the graph. When you release the mouse the line will disappear.
Plus/Pro users: If you have the intraday price displayed on your historical graph, the line will snap to the latest price.
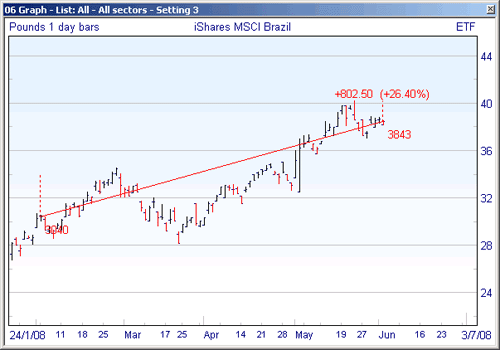
If you want the Percentage Change line to stay on the graph once you have drawn it, press down the Shift key before you click and drag on the graph, and release the Shift key only once you have released the mouse button. You can click on either end of the line and move it to a different position if required, or press the Delete key on your keyboard to remove it.

Note that this time, the change is displayed at the end of the line.
You can change the properties of the line by double clicking on it to access the Line Colour and Settings dialog. If you want any changes you make in this dialog to apply to all future Percentage Change lines you draw, remember to tick the Set as default option.
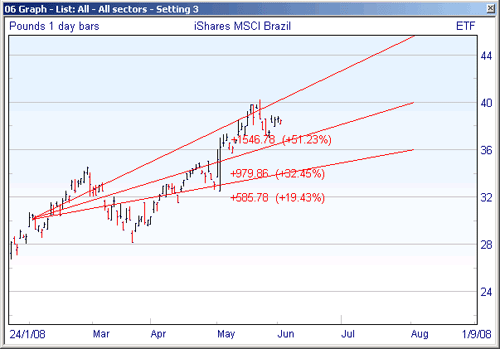
You can also choose to display the percentage change for any line drawn on a graph. This may be useful if you wish to measure the percentage change from an intraday price (e.g. your entry price) rather than the close price, or if you wish to estimate the percentage change up to a point in the future.
To do this, draw the line on your graph. Then double click on the line to display the Line Colour and Settings dialog. Here you can select the option to Show percentage change. Again, tick Set as default if you want all future lines to also display this by default.

Remember, if you have any trouble finding or using any of these features, please don't hesitate to contact our Customer Support team. They will be delighted to help.