The difference between volatility & risk
When people think about making an investment in something, more often than not they will think about how it could make them a lot of money. But what they often don't think about is what could go wrong and the risks they are taking with their money. The recent shakiness of world stock markets is a sharp reminder to everyone that putting your money in shares can be very risky indeed.
Good investors spend a lot of time thinking about risks. By controlling the amount of risk you take with your money it is possible to be a more successful investor whilst sleeping more soundly at night.
But what do we mean by volatility and risk? What do they really mean to you as an investor?
In this article, I want to explain three things to you:
- What volatility is and why it is important.
- How you can use ShareScope to analyse volatility for stock markets and individual shares.
- What investment risk is and things you can do to control it.
Let's get started.
Phil Oakley's debut book - out now!
Phil shares his investment approach in his new book How to Pick Quality Shares. If you've enjoyed his weekly articles, newsletters and Step-by-Step Guide to Stock Analysis, this book is for you.
Share this article with your friends and colleagues:
Volatility is not the same as risk
One of the worst things about the world of finance is that it is full of jargon that the ordinary person in the street cannot understand. Finance professionals and academics are often the worst culprits here. Ask them what investment risk is and they'll probably mention the word 'volatility'. But what are they really talking about?
Volatility refers to how much the returns of an investment bounce around their long term average levels. The amount of bounce is measured by the standard deviation of returns. The more volatile they are, the bigger the standard deviation. Don't worry too much about the maths here, it's more important to understand what it is explaining.
For example, in the 30 years between 1983 and 2013, UK shares gave an average annual return (the change in share prices plus dividends received) of 11.8% with a standard deviation of 16.4%. What this actually means in practice is that for around two thirds of the time (or one standard deviation) returns ranged between 28.2% (11.8% + 16.4%) and -4.6% (11.8% - 16.4%).
In comparison, inflation-linked government bonds had an average return of 5.5% with a standard deviation of 3.7%. Historical results like this are often used to back up the view that shares are a lot more risky than bonds - because they are more volatile.
Academics like measures such as volatility because they can calculate it and put it into their theoretical models. These models lead many of them to think that they can predict the future and control the amount of risk that they take. Experience says that this is not true.
When it comes to the world of finance, it is important to realise that what happens is largely a function of human behaviour and this is not possible to accurately predict. That's because the unexpected can - and often does - happen.
So does higher volatility really mean higher risk? Not necessarily is the answer.
Volatility is not the same as risk. A share of a company isn't necessarily risky because it is volatile. But a share can be volatile if the underlying business behind it is risky. This might be because its profits have a tendency to fluctuate a lot. Companies such as house builders or airlines for instance.
Very few investors will tell you that they are afraid of volatile share prices, but a lot of them will probably say that they are afraid of losing money. In the real world this is what risk is. It's about the possibility of losing money.
But that doesn't mean that volatility isn't important.
If you buy very volatile shares you can end up losing money (as I'll explain later). So taking some time to understand volatility is probably worthwhile.
How to look at volatility in ShareScope
ShareScope calculates the historic volatility values for shares. You can choose what time period you want to calculate volatility over. Here's how to do it:
- Create a list of shares to look at. You can do this by selecting the View menu, then Change List and then selecting the group of shares you would like to look at such as the FTSE 100.
- Gold customers can use the Volatility option on the Add General column (right-click in the column heading of your table) which uses the entire price history ShareScope holds for each share.
Plus and Pro users have access to a number of risk analysis columns via the Add a Risk Analysis column option which enable fine control over the parameters used. This displays the following dialog:
In the Indicator type column select Volatility and then set the quarterly periods to 40 for a ten year period and select OK.
- Double click on the volatility column to sort your shares in ascending or descending order of volatility. Selecting the shares with the highest volatility for the FTSE 100 gives me the following list:

It's not really that surprising that the most volatile shares in the FTSE 100 over the last ten years come from areas of the economy that took a battering during the financial crisis of 2007-08 - housebuilding, banks, mining and airlines.

How volatility can be useful to you
Remember that volatility figures relate to what happened in the past. The same pattern of share price ups and downs may well be different in the future. However, if you come across a share that has been very volatile then it may be telling you that the underlying business has had a bit of a rocky past which could - but not necessarily - happen again in the future. That said, looking at a share's volatility history could help you spot the right time to buy and sell it. I'll show you how.
One of the many powerful charting features in ShareScope is that you can plot the historic volatility of a share along with its share price. I've done this for Barratt Developments - the most volatile share in the list above. It's very easy to do.
This shows a ten year price and volatility chart for Barratt Developments. What you often see is that volatility (the blue line) peaks when a share price bottoms (alternatively share prices bottom when volatility peaks). In many cases this can signal a buying opportunity. (However, I do suggest that you research the company before buying any share).

Volatility is seen as a kind of 'fear gauge' which tends to spike upwards as people get scared that share prices will continue to fall and so they sell out. One of Warren Buffett's famous quotes is "be fearful when others are greedy and greedy when others are fearful.", so using a fear gauge such as volatility could be a useful tool for you. Buffett made some of his greatest investments when people were running scared.
So if you see that the volatility of a share or index is beginning to rise it may help you gauge the sentiment of investors and help you decide when to buy or sell. It requires a cool head, but buying when pessimism (high volatility) is very high and selling when people are too relaxed (low volatility) could be part of a successful investment strategy.
I say part because looking at volatility alone is probably not wise. You have to consider other things such as how the company's business is faring and more importantly the valuation of its shares. Otherwise you may be going against one of the most common pieces of investment advice: "never catch a falling knife" - a term used to explain buying a share where the price has fallen a long way but keeps on falling (possibly all the way to zero).
But if you are looking to find a depressed share to buy, an ideal mix would be high volatility, a low share price, depressed profits that can recover and a cheap valuation. Picking shares with these characteristics is how some of the world's most successful investors have made their fortunes. It's much easier said than done though and hindsight is a wonderful thing, but buying shares of Barratt Developments at the end of 2008 or beginning of 2009 ticked a lot of these boxes.
A closer look at Barratt Developments
I've created a results table for Barratt Developments from ShareScope. This is a great way to look at the history of a company and drill down into its financial statements. You can also see how the market was valuing the company in the past. I've used price to tangible net asset value here which is arguably one of the best valuation methods for a company like Barratt.
I'm not going to get into an in-depth analysis now but am using the results table to highlight a few key points.
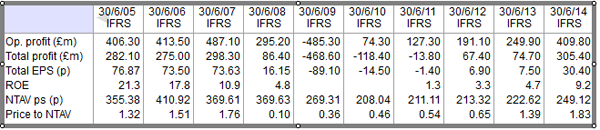
Up until 2005, Barratt had been a high flyer. Its profits had been growing and it had been earning high returns on equity (ROE). But it started to stutter in 2006 as earnings per share (EPS) stagnated before collapsing in 2008.
The most important thing to note here is that the valuation of the shares collapsed too. The market had been valuing the shares at 1.8 times its tangible net assets in 2007 but priced them at a fraction of that in 2008 and 2009.
The pessimism baked into the share price (the high volatility) combined with the very low valuation at the time was - admittedly with hindsight - a wonderful buying opportunity. This was because the company's profits had the ability to recover.
Investors brave enough to buy Barratt shares when the outlook looked bleak have made a lot of money.
Volatility and the markets
Over in America they have a separate index that looks at volatility for the S&P 500 index as a whole. It's called the VIX index. It is an expectation of how much future share prices - in this case the value of the S&P 500 index - are expected to bounce around.
The value of the VIX is worked out by looking at the price people are willing to pay for the option to buy and sell the S&P 500 in the future. These prices are known as premiums. The bigger the perceived risks the higher the premium investors are willing to pay. The VIX then takes a weighted average of all the premiums out there and comes up with a number.
But what does this number actually mean?
Let's say that the VIX is 10. What this means is that the value of the S&P 500 is expected to move up or down by 10% for around two thirds of the time (or one standard deviation) during the next year. Big wild swings are unnerving for most people, so low VIX numbers are often seen as a sign that all is well.
As a rough rule of thumb, the bigger the VIX number the more fearful investors are. As the VIX heads above 30 investors are seen as becoming more nervous. Below 20 and they are fairly relaxed about life, maybe too much so.
Yet you should probably worry more about a low VIX number. It says that investors aren't worrying much. In fact they may have become very overconfident, complacent or greedy. This often means that trouble isn't far away.
You can get a chart of the VIX in ShareScope (you can find it in the list of indices) as shown below:

In fact, there are two VIX indices - an old methodology and a new methodology. Don't worry about the difference; I've used the newer version.
If you then plot a chart of the VIX against the S&P 500 you can see that they tend to move in opposite directions to each other. When investors are happy and optimistic about the future, the VIX is low and share prices tend to go up. When they get frightened, the VIX spikes and this tends to coincide with falling share prices.
So what could the VIX be telling us now?
At the moment, the VIX is just below 20 and the S&P 500 is hovering around its all-time high level. On the face of things it suggests that there isn't much fear about and that investors look to be in a bullish mood. But have a closer look and you can see that the VIX has been rising from the very subdued levels seen in the last couple of years.
I can't predict the future but studying the history of markets is something we can all learn from. The last time the VIX traded at such low levels was in the run up to the financial crisis in 2007-08 before they experienced a tremendous spike as share prices crashed.
Now I'm not saying that the markets are about to crash. But I think that volatility and measures such as the VIX are great ways for you to weigh up market sentiment and can help you become a smarter investor.

Volatility and your emotions
The last thing I want to say about volatility is how it can play havoc with your emotions.
Have a look at the 20 year chart of the FTSE 100 and its volatility. What you can see is that the value of the FTSE 100 has bounced around a lot. Just as we have seen with the S&P 500, the FTSE 100 has seen similar spikes and troughs in volatility.
These ups and downs can play havoc with your emotions and cause you to do the wrong thing. It's blindingly obvious but a very effective way to make money from shares is to buy at a low price and sell at a high one.
What seems to happen in the real world is that people buy when prices are high - thinking that they will keep on going up - and panic and sell when they are crashing - thinking that they will keep on falling. This is because they get too hung up by the wild ups and downs that come with share ownership.
This is really the main risk that volatility poses for investors. It is the risk of forcing you into selling a share at precisely the wrong time (in other words, when everybody else seems to be doing the same thing). This is the kind of risk you might face if you are holding shares in your portfolio just before you need some cash (or turning a pension fund into an income stream). That's why lots of pension funds might shift their members' savings pots away from shares just before they retire (part of a process known as lifestyle investing).
However, if you buy the right investment at the right price you don't tend to worry about volatility as much. Over time it smooths itself out. That's why trying to understand volatility is important.

The risk of losing money
Investing in shares is risky. There are lots of reasons why this is so. First and foremost, if you are a shareholder in a company you are last in the queue to get paid your share of the profits or your share of the assets if the company is liquidated.
So there is a risk that you could lose all of your money. Shareholders usually accept this risk because if the company does well they can make big gains.
Despite measures such as volatility, risk is all about the potential of losing money. This is largely a function of what you pay for an investment. Pay too much by buying an expensively valued share and the risk of losing money is often quite high. Buy an undervalued share where expectations of the future are not high and the risk is much less. In fact, there's a good chance you could make money.
The good news for you is that the price you pay for an investment is totally within your control. You don't have to buy something straight away. Unlike many professional investors you can afford to be patient and wait for the right price. This means you can go a long way to controlling your investment risk.
This is the basic philosophy behind value investing - buying investments for a lot less than they are worth. The seeking out of this all important margin of safety means that lots of things can go wrong and you can still make money because it's already been factored in to the share price. I'll talk a lot more about this style of investing in the future.
Despite lots of supposedly sophisticated investors out there, what you'll tend to find is that the stock markets are herd-like. There is also a tendency for good times and bad times to be extrapolated permanently into the future. The trouble with this is that good companies quickly become expensive. When the good times end, the shares have nowhere to go but down. For the beaten up shares lots of bad news is in the price. So when things get better the shares have the potential to be very good investments.
How to minimise your investment risk
Here are a few tips to controlling your risks:
- Understand the business behind the investment. It stands to reason that a water company where demand for the product is largely unaffected by what's going on in the wider economy is a less risky business than a steel mill where demand goes up and down a lot. Study the history of a company and learn about how it profits behave in different economic climates.
- Expect the unexpected. Bad things can and will happen. 2008 is a stark reminder of this.
- Spread your money across different investment classes - shares, bonds, property and cash all have their place in a well-diversified portfolio. This can reduce risk as they all tend to behave differently in different states of the world. That said, in times of sheer panic it's not uncommon for many investments in a diversified portfolio to behave quite similarly to each other as investors try to cash out. This is what happened in the panic of 2008.
- Don't be afraid to hold cash. Being fully invested in the markets at all times means that it is more difficult to pick up bargains when they present themselves.
- Focus on valuations. This is very important. The price that you pay for something is the all important determinant of how much money you will ultimately make. It is usually better to buy a decent company at a cheap price than a fantastic one at an expensive price.
- Look for buying when prices are falling. This requires discipline but is a lot easier than when prices are going up. That's because there's lots of people wanting to sell and not many wanting to buy. Be prepared for prices to go lower still. You will very rarely call the bottom of a price fall.
- Be wary of companies whose share prices are falling but have too much debt. If there is something badly wrong with the company you can be wiped out and lose all your money if things get really bad.
If you have found this article of interest, please feel free to share it with your friends and colleagues:
We welcome suggestions for future articles - please email me at analysis@sharescope.co.uk. You can also follow me on Twitter @PhilJOakley. If you'd like to know when a new article or chapter for the Step-by-Step Guide is published, send us your email address using the form at the top of the page. You don't need to be a subscriber.
This article is for educational purposes only. It is not a recommendation to buy or sell shares or other investments. Do your own research before buying or selling any investment or seek professional financial advice.