Stock Watch: Ashtead Group
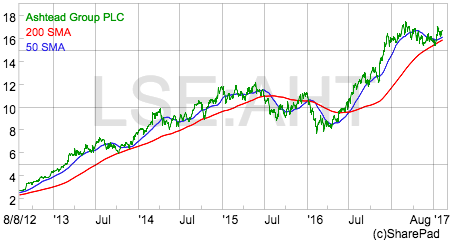
Ashtead makes its money by renting out equipment to construction and industrial companies - things like aerial platforms, forklift trucks, tools, diggers, cranes, power generators and pumps. It makes most of its profits in America and its shares have been a terrific investment. They have been a proverbial ten bagger over the last decade.
After such as stellar run it's only natural to ask whether there's much left on the table for investors. So I've decided to take a look at this interesting company.
I'll say straight away that I like a lot of what I see in Ashtead. Its annual report is a superb document that really helps investors to understand what it does and how it makes money and is well worth reading.
We are all looking for investments that can grow the value of our savings. One of the best ways of doing so it to invest in a business which can earn high rates of return on the money (often referred to as capital) it invests - at the right price.
Ashtead has done this with bells on over the last decade.
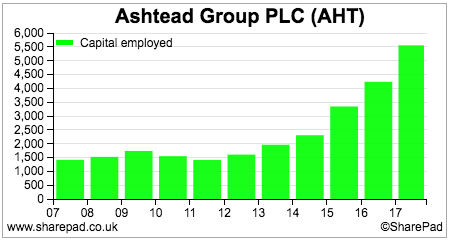
As you can see from the chart below it has ploughed huge amounts of cash into its business in recent years.
This money has earned lots of money in return. After adjusting for rented assets, return on capital has been impressive and is just under 20%. When you are investing large sums of money at high rates of return your profits go up a lot. This largely explains why Ashtead's share price has gone through the roof.
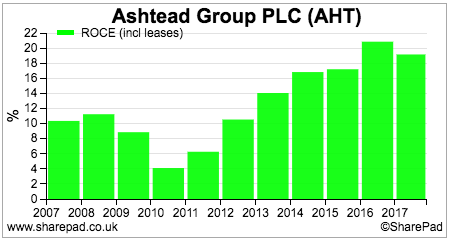
Note the big dip in ROCE on 2010. This is telling us that Ashtead is a cyclical business. I'll come back to this issue later on.
What might put people off Ashtead if they are just glancing at the business is that it has not produced huge amounts of free cash flow with this impressive rate of growth in its profits.
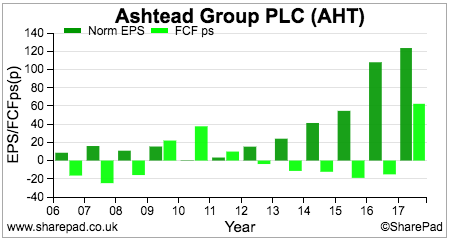
As you can see, free cash flow per share is quite often negative and lags EPS. Rest assured this is not a sign of dodgy accounting but just a characteristic of this asset intensive business.
To grow profits it needs to spend a lot of cash buying new equipment. This consumes cash flow. Once the business stop growing it tends to throw off lots of free cash flow. As I will show shortly, the underlying free cash flow of Ashtead is actually quite good.
The other issue that might concern people is debt. It is very common for rental companies to finance their assets with debt - even more so when interest rates are as low as they are at the moment.
You can see that debt (or borrowings if you prefer that term) has increased substantially as Ashtead has invested in new assets.
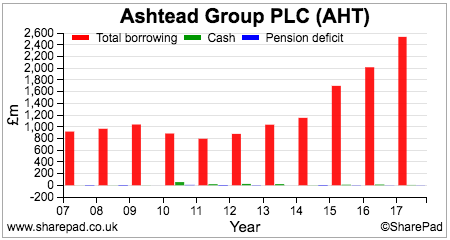
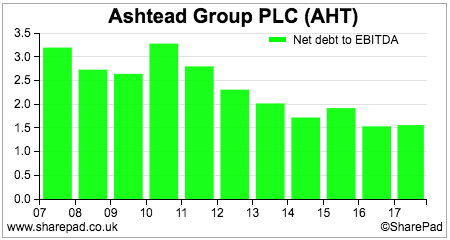
Yet Ashtead's gross cash flows have increased at a faster rate. Its key measure of indebtedness - net debt to EBITDA - has been falling and is less than half its peak level seen as the top of the last economic cycle.
The company's financial position is very strong at the moment with the interest payments on borrowings covered nearly ten times by operating profits.
Phil Oakley's debut book - out now!
Phil shares his investment approach in his new book How to Pick Quality Shares. If you've enjoyed his weekly articles, newsletters and Step-by-Step Guide to Stock Analysis, this book is for you.
Share this article with your friends and colleagues:
How to weigh up Ashtead's business performance
When you are looking at an equipment rental business like Ashtead there are some key performance indicators that are worthwhile keeping an eye on. The company's annual report is packed full of useful information which allows the diligent investor to build up a decent picture of how the business has been getting on.
I will look at the US and UK businesses in turn.
The bulk of the Ashtead's profit come from its US business which trades under the name of Sunbelt. It is the second biggest equipment rental business in North America with around 7% of the market (NYSE listed United Rentals is the biggest with 10% and a market value of $10bn). Sunbelt has 612 stores in 47 US states as well as 17 stores in Canada.
Let's take a closer look at Sunbelt. What I've done here is to look at the performance of the business over an economic cycle in order to help me understand what happens to profits and returns in different economic climates. Collecting the data involves going through ten years' annual reports and does take a bit of time but is well worth it in my opinion.
Here's the key data on the business for the last ten years.
| Sunbelt (£m) | Sales | EBITDA | EBIT | Avg Fleet Value | Physical Utilisation | $ Utilisation | Replacement Capex | Total Capex |
|---|---|---|---|---|---|---|---|---|
| 2008 | 810 | 298.4 | 164.9 | 1140 | 68% | 62% | 177.8 | |
| 2009 | 865.5 | 298.7 | 144.4 | 1541 | 66% | 57% | 149.1 | |
| 2010 | 674.5 | 219 | 72.7 | 1388 | 64% | 47% | 45.5 | |
| 2011 | 782.7 | 248.1 | 103.6 | 1271 | 69% | 51% | 176.9 | |
| 2012 | 945.7 | 339.4 | 181.9 | 1428 | 70% | 58% | 180 | 362.2 |
| 2013 | 1155.8 | 470.9 | 287.4 | 1735 | 71% | 60% | 212.2 | 458.5 |
| 2014 | 1366.2 | 616.5 | 394 | 1927 | 71% | 61% | 182.4 | 570.5 |
| 2015 | 1715.9 | 809.2 | 520.9 | 2722 | 70% | 59% | 256.9 | 825.3 |
| 2016 | 2180.9 | 1054.1 | 674.7 | 3553 | 70% | 56% | 390.3 | 984.8 |
| 2017 | 2768.6 | 1366.4 | 840.9 | 4764 | 71% | 53% | 311.4 | 819.1 |
We can easily see the rapid growth in sales, profits, average fleet value and capex (spending on new equipment assets). There are also two other key performance measures.
Physical utilisation measures the amount of time a piece of rental equipment is out on hire. Ashtead targets a physical utilisation rate of between 60% and 70%. 100% utilisation is not possible due to issues such as maintenance and seasonal demand.
If utilisation falls below 60% then the yield on equipment tends to fall as prices have to be cut to stimulate demand. With utilisation above 70% the company may not have enough equipment to manage demand.
Utilisation is currently high and has been consistently good with the exception of 2009-10 when the effects of recession saw it fall to 64%.
Dollar utilisation measures the annual revenue from equipment as a percentage of its cost. The higher it is the more profitable Sunbelt will be. This will depend on the mix of equipment on hire and the markets being served by it.
You can see that dollar utilisation has been on a downwards trend recently. Is this a sign that the company may have overextended itself? Not really. The trend is due to the fact that Sunbelt has opened up lots of new locations which are still maturing. As these new outlets mature the dollar utilisation should improve.
Let's dig a little deeper into the numbers.
| Analysis | EBIT margin | EBITDA margin | ROA | EBITDA less Capex | EBITDA less M Capex | Capex to Sales |
|---|---|---|---|---|---|---|
| 2008 | 20.36% | 36.84% | 14.46% | 120.6 | 21.95% | |
| 2009 | 16.68% | 34.51% | 9.37% | 149.6 | 17.23% | |
| 2010 | 10.78% | 32.47% | 5.24% | 173.5 | 6.75% | |
| 2011 | 13.24% | 31.70% | 8.15% | 71.2 | 22.60% | |
| 2012 | 19.23% | 35.89% | 12.74% | -22.8 | 159.4 | 38.30% |
| 2013 | 24.87% | 40.74% | 16.56% | 12.4 | 258.7 | 39.67% |
| 2014 | 28.84% | 45.13% | 20.45% | 46 | 434.1 | 41.76% |
| 2015 | 30.36% | 47.16% | 19.14% | -16.1 | 552.3 | 48.10% |
| 2016 | 30.94% | 48.33% | 18.99% | 69.3 | 663.8 | 45.16% |
| 2017 | 30.37% | 49.35% | 17.65% | 547.3 | 1055 | 29.59% |
The business is very profitable with high margins. The return on assets (EBIT as a percentage of average fleet value) is also very respectable.
Ashtead has helpfully provided a split of its capital spending between replacement or maintenance capex (the cost of replacing worn out equipment) and spending on new assets. What this allows the investor to do is to get a feel for the underlying cash generation of a business. This can be done by taking away capex from EBITDA to get a pre-interest, pre-tax cash flow figure (ignoring changes in working capital as well).
What we can see here is that Sunbelt is generating a lot of cash flow at the moment. EBITDA less replacement capex was over $1billion in 2016/17 compared with EBIT of £840.9m.
The reason why underlying cash generation is so good at Sunbelt at the moment is because replacement capex is quite low. Assets that were bought in 2009, 2010 and 2011 - when the US economy was relatively weak - are now being replaced.
This benefit should continue for a couple more years. Given an average asset life of around 7 years, replacement capex should start increasing significantly afterwards as the big growth in new assets from 2012 onwards will need to be replaced.
I have highlighted 2010 to show you what happens in a recession. Capex tends to be slashed - as evidenced by the sharp fall in the capex to sales ratio - and cash flow increases on the back of weak profits. The age of the rental fleet is allowed to increase and the company focuses on cash flow to protect its financial position.
Ashtead's UK business is known as A-Plant. It is the UK market leader with a share of around 7%. Companies such as Speedy Hire and HSS are close behind with estimated market shares of 6%.
| A-Plant (£m) | Sales | EBITDA | EBIT | Avg Fleet Value | Physical Utilisation | $ Utilisation | Rep Capex | Total Capex |
|---|---|---|---|---|---|---|---|---|
| 2008 | 237.8 | 73.2 | 30.2 | 346 | 71% | 60% | 108.3 | |
| 2009 | 208 | 62.8 | 16.1 | 365 | 67% | 52% | 58.4 | |
| 2010 | 162.3 | 42 | 1.8 | 319 | 69% | 48% | 10.1 | |
| 2011 | 165.8 | 43.1 | 2.7 | 330 | 69% | 47% | 25.5 | |
| 2012 | 188.9 | 49.5 | 7.3 | 352 | 65% | 48% | 44.4 | 59 |
| 2013 | 206.1 | 57.3 | 11.9 | 375 | 69% | 49% | 50.7 | 62.5 |
| 2014 | 268.5 | 78.6 | 25.2 | 432 | 72% | 56% | 49 | 86.5 |
| 2015 | 323 | 109.5 | 46.3 | 513 | 70% | 56% | 46.2 | 153.8 |
| 2016 | 364.8 | 137 | 67 | 600 | 68% | 52% | 95.2 | 141.8 |
| 2017 | 418.2 | 152.8 | 71.6 | 712 | 69% | 51% | 74 | 164.1 |
A-Plant is not as impressive as Sunbelt.
| Analysis | EBIT margin | EBITDA margin | ROA | EBITDA less Capex | EBITDA less M Capex | Capex to Sales |
|---|---|---|---|---|---|---|
| 2008 | 12.70% | 30.78% | 8.73% | -35.1 | 45.54% | |
| 2009 | 7.74% | 30.19% | 4.41% | 4.4 | 28.08% | |
| 2010 | 1.11% | 25.88% | 0.56% | 31.9 | 6.22% | |
| 2011 | 1.63% | 26.00% | 0.82% | 17.6 | 15.38% | |
| 2012 | 3.86% | 26.20% | 2.07% | -9.5 | 5.1 | 31.23% |
| 2013 | 5.77% | 27.80% | 3.17% | -5.2 | 6.6 | 30.33% |
| 2014 | 9.39% | 29.27% | 5.83% | -7.9 | 29.6 | 32.22% |
| 2015 | 14.33% | 33.90% | 9.03% | -44.3 | 63.3 | 47.62% |
| 2016 | 18.37% | 37.55% | 11.17% | -4.8 | 41.8 | 38.87% |
| 2017 | 17.12% | 36.54% | 10.06% | -11.3 | 78.8 | 39.24% |
Profit margins and return on assets are not as good - they are reasonable rather than very good and perhaps reflect the more competitive nature of the market compared with North America.
Free cash flow has been negative but as with Sunbelt the underlying cash generation is good. Note how badly profits were hit during the last recession and the slashing of capex to cope with this as in the USA.
Checking the quality of rental company profits
When I worked in the City rental companies were widely treated with suspicion. This was because there is ample scope to cook the books. The easiest way to do this is to under depreciate the equipment assets and report higher profits.
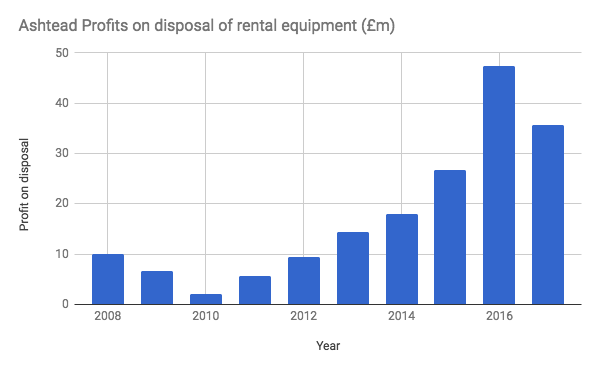
Fortunately there is an easy way to spot if this has been going on. The clear sign is consistent losses on disposals of fixed assets. If a company has been under depreciating an asset its balance sheet value will be more than its resale value. The low depreciation boosts trading profits when it is in use but the company still pays the bill when it comes to sell the asset by making a loss on disposal.
You can check for profits or losses on disposal by looking at the notes to the accounts and studying the reconciliation of trading profits to trading cash flow. A profit on disposal is not an operating cash flow and will be shown as a negative item in the reconciliation. A loss will be added back and shown as a positive number.
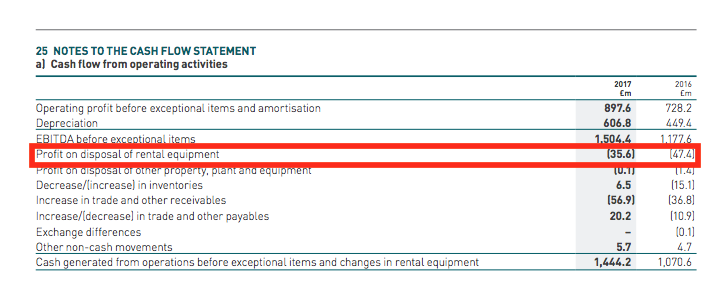
Here we can see that Ashtead is reporting healthy profits on the disposal of rental equipment. The chart below shows that it has made profits consistently over the last economic cycle - a sign that its depreciation policy and profits are prudently stated and one that should be rated highly by investors.
Can Ashtead keep growing its profits?
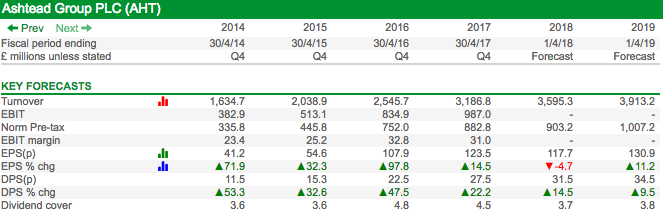
Turnover, trading profits and dividends are expected to keep on growing but at a slower rate than previously. The company has been a big beneficiary from the weakness in sterling and that effect will begin to moderate and wear off based on current exchange rates.
The company has ambitious plans to grow its market share. The US market is also less mature than the UK with the rental concept still growing in popularity. Two thirds of the market growth in the US between 2011 and 2016 come from companies switching from owning to renting equipment and this trend is expected to continue as the benefits and awareness of its flexibility increase.
The US market is also highly fragmented with lots of small independent local operators. These companies do not have the scale to compete with Sunbelt or United Rentals and it is expected that many will be acquired over the next few years.
The US market is expected to grow by around 5% per year for the next few years - underpinned by the construction industry - with Ashtead aiming to grow faster than this. It wants to double its market share with the aim of growing to 875 locations and sales of over $5bn by 2021. It also sees growth from increasing and and broadening its range of rental equipment.
The company also intends to grow in Canada and increase its market share in the UK.
Ashtead's track record suggests that it has a good chance of achieving these aims. However, the economy will turn down again in the future and history suggests that profits will be hit hard when this happens.
This makes Ashtead shares quite hard to value. Over the economic cycle i would expect Ashtead to be able to keep on growing its profits. The timing and magnitude of those profits does have a reasonable degree of uncertainty attached to them though.

The shares have derated during 2017 despite 2018 profit forecasts nudging up. Back in December 2016 they were trading on a forward PE of 16.5 times compared with 14.1 times now.
They are not horrendously expensive given the high quality nature of Ashtead's business and profitability but it seems that some nervousness about the future is being baked into the share price. I think a long-term investor (holding period of at least 5 years) can probably make money from this share but there is a possibility that the journey could be a rocky one. At the very least Ashtead is a share that most investors should stick on their watchlist.
If you have found this article of interest, please feel free to share it with your friends and colleagues:
We welcome suggestions for future articles - please email me at analysis@sharescope.co.uk. You can also follow me on Twitter @PhilJOakley. If you'd like to know when a new article or chapter for the Step-by-Step Guide is published, send us your email address using the form at the top of the page. You don't need to be a subscriber.
This article is for educational purposes only. It is not a recommendation to buy or sell shares or other investments. Do your own research before buying or selling any investment or seek professional financial advice.